Measuring Conversion Lift: How to Prove Your Product Video Really Drives Revenue
Every vendor claims their tool delivers conversion lift. How to measure honestly, without expensive A/B test software, whether your video really sells — and which numbers smell suspiciously like confirmation bias.

There are two kinds of sellers claiming their product video brings conversion lift. The ones who measured. And the ones who feel things are running better since the video went up. The difference sounds small but is enormous — because without measurement, nobody knows whether the revenue bump comes from the video, from a better season, from a new influencer, or simply from running more ads that month.
Whoever knows the lift can decide with reason where the next video budget goes. Whoever only guesses is optimizing blind.
Which numbers actually matter
Before we talk about tests, a quick sort of the relevant metrics. Not every KPI reacts to video equally fast, and not every one is equally meaningful.
- Add-to-Cart rate — share of visitors who add the product to cart. Reacts quickly, has lots of volume, is the best early indicator
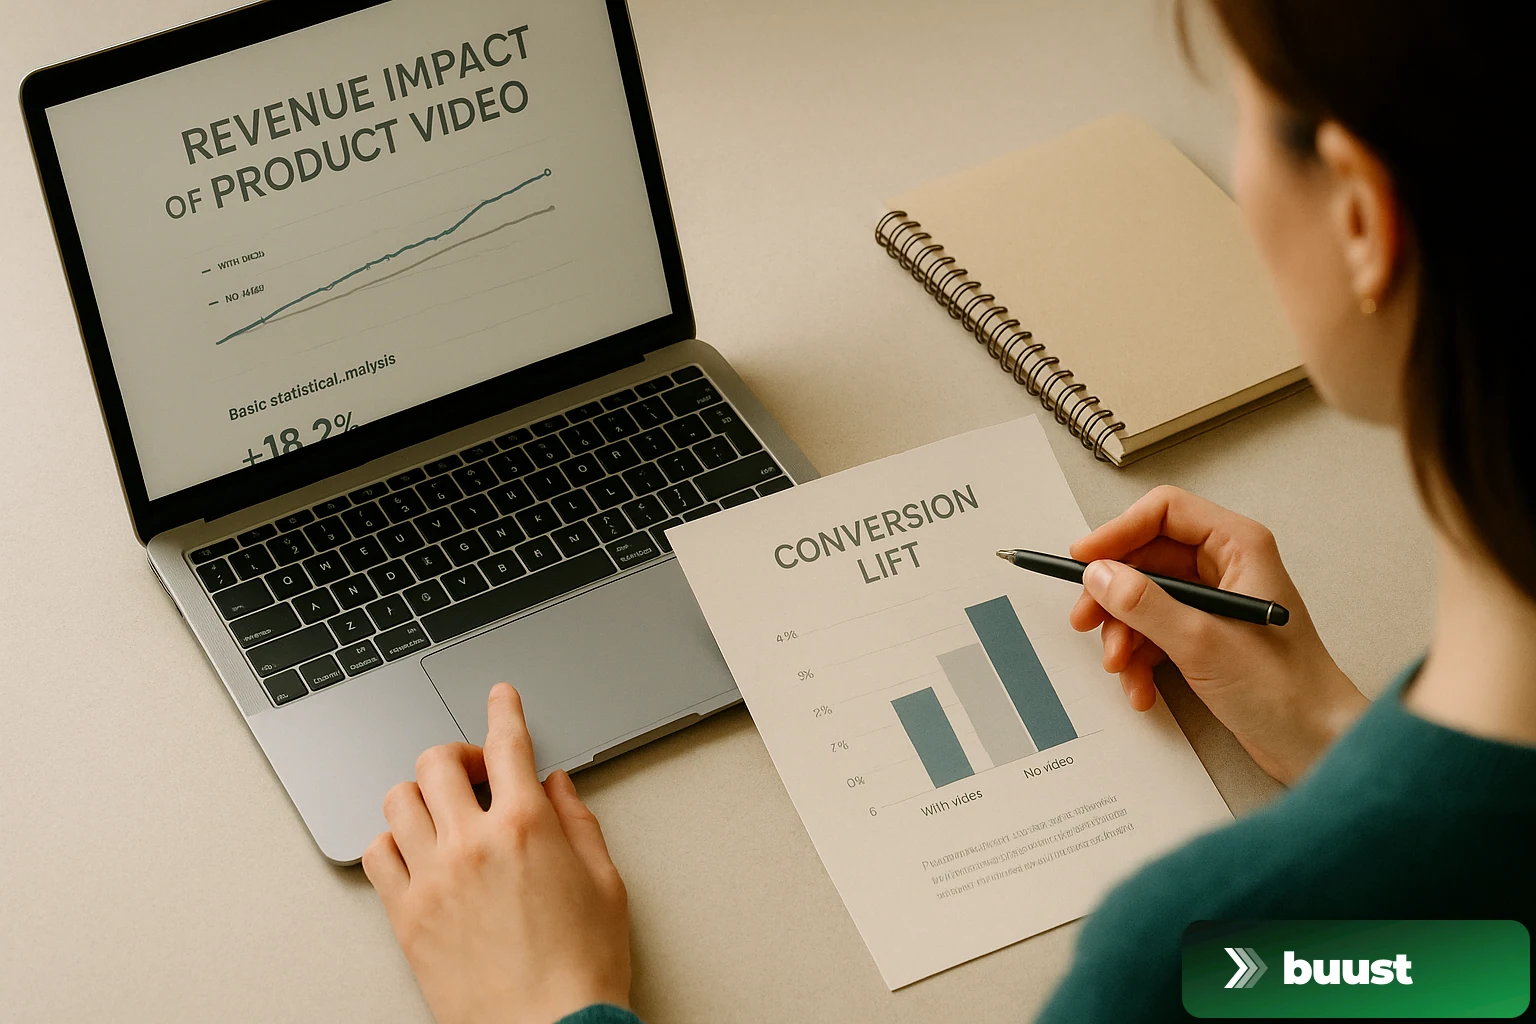
- Conversion rate — share of visitors who actually buy. The honest end number, but needs more time for significance
- Dwell time on the product page — almost always rises with video, but on its own only a hint, not proof
- Bounce rate — typically drops when video runs. Important because it also affects marketplace rankings
- Return rate — the underrated number. If it stays stable or drops while conversion rises, you have real added revenue and not just cash flow before returns
Caution: focusing only on conversion rate misses the whole picture. A 25 percent conversion lift is worth nothing if the return rate rises from 8 to 18 percent in parallel.
The simplest test: before-after with the same listings
If you do not feel like dealing with theme splits and variant cookies, you can start with an honest before-after comparison — if a few conditions are met.
Pick ten to twenty products that sell regularly. Hold at least four weeks of baseline data before embedding video: sessions, Add-to-Cart, conversion, average cart value, return rate. Then embed video. Watch the same products over the next four weeks under the same external conditions — no new ad push, no seasonal sale, no price change in that window.
What you have afterwards is not a textbook A/B test, but a credible trend. If conversion rises 15 percent across all ten products and the return rate stays stable, that is a real signal. If it rises 40 percent on three products and falls slightly on seven, you have most likely measured seasonal noise.
The clean test: half the catalog as a control group
If you have a large catalog, you can be more elegant. Split your catalog into two comparable halves — same category distribution, same price range, same traffic share. One half gets video, the other does not. Both run in parallel.
The advantage: seasonal, advertising and algorithm effects hit both halves equally. What differs between groups is the video. After four to six weeks you compare the conversion rate change between the two groups. If the video group grew significantly more, you have a very honest lift value.
This method is statistically clean, but has a catch: you voluntarily leave half the conversion lift on the table while the test runs. Anyone convinced of the lever resents that. But anyone who trades six weeks for honesty and then scales on real numbers wins long term.
The convenient test: Shopify theme variants or similar mechanics
In Shopify you can build a real split via theme versions or targeted variant cookies: 50 percent of visitors see the product page with video, 50 percent without. Conversion data is tracked separately via UTM parameters or custom events in your analytics.
WooCommerce and Shopware offer similar paths via theme switching or server-side variants. If you do not want to build it yourself, you can use tools like Google Optimize successors, VWO or Convert.
Important: run for at least two weeks, at least 500 purchases per variant, otherwise the numbers are noise. A three-day-old "+47% conversion" claim from a test with 80 purchases per side is marketing, not measurement.
What gives away confirmation bias
Anyone trying a new tool wants it to work. That is human — and dangerous for analysis. A few warning signs that you are telling yourself a story:
- You compare the best week with video against the worst week without video
- You only look at products where it worked and ignore the others
- You raised ad spend in parallel with embedding video
- You have a conversion lift but no revenue lift — meaning the cart value dropped
- The lift looks suspiciously round: "+50%" or "doubled" is statistically rarely clean
An honest lift usually looks unspectacular: ten to thirty percent over a larger test window, with light fluctuation by category. Anyone with "+120% conversion in two weeks" on their first test slide should look at the data twice before forwarding it.
Realistic benchmarks for your expectation
From the customer data we see at Buust over the last months, rough ranges per category emerge — these are not guarantees, just orders of magnitude you can use as a sanity check:
- Fashion, jewelry, accessories — 15 to 35 percent conversion lift with a good product video
- Furniture, home decor, garden — 20 to 40 percent, because scale and material gain heavily through video
- Electronics, tools, devices — 10 to 25 percent, because function demonstration genuinely convinces
- Food, cosmetics, drugstore — 5 to 20 percent, depending on how visible the product is in use
- B2B components, spare parts — often under 10 percent, because the purchase decision runs on hard data
If your number lands in these ranges, you believe yourself. If it lands far above, check whether you are really measuring video in isolation or whether something else is running alongside.
What you can do starting today
Before generating new videos, hold four weeks of baseline. If you already produce video, start tracking the right numbers instead of saying "it is running better". Anyone who measures has arguments in six months — for their own gut feeling, for the team, for reinvestment.
With Buust you generate product videos for your entire catalog and embed them on product pages without a theme rebuild. That is what makes the lift test practical in the first place, because instead of uploading individual listings for two weeks, you equip an entire control group at once.
Start for free, turn it on for half your catalog, run it for four weeks — and you have your own honest lift number. No confirmation bias story, but real data from your own shop.
Common questions on the topic
Do I need an A/B test tool to measure video lift?+
No. For a first credible answer it is enough to compare the same products before and after embedding video over one to two months. For cleaner tests a theme variant in Shopify or half of your catalog as a control group is enough. Tools like Optimizely or VWO make it more convenient, but are not mandatory for an honest lift check.
What is a realistic conversion lift from product videos?+
In most shop categories we see 10 to 30 percent more conversion on product pages with video versus photo-only. In highly visual categories like fashion, furniture or sports equipment it can move towards 40 percent. Anything above 80 percent should make you suspicious — either the baseline was bad or the measurement was sloppy.
Which metric matters more — Add-to-Cart or conversion rate?+
Both have their place. Add-to-Cart rate reacts faster and with more data points, because more visitors add to cart than buy. Conversion rate is the more honest end number, but takes weeks to become statistically reliable for smaller shops. If you see both rising at the same time, you very likely have real lift.
Can videos change the return rate?+
Yes, both ways. If the video shows the product realistically — scale, material, real workmanship — the return rate drops because buyers know what they are ordering. If the video over-stages and the product disappoints in the box, the return rate rises. A stable or falling return rate combined with rising conversion is the most honest signal for "real" sales gain.
Ready to switch your listings to video?
10 videos free. No credit card. Connected in under 5 minutes.
Keep reading
Try it on right in your shop: how virtual try-ons cut returns
The most expensive return is the one that should never have happened — ordered "in two sizes to try". A virtual try-on answers the "does this suit me?" question before the purchase. Here's how try-on works in your own shop.
The Buust Score: how well does your listing actually sell — and what to do next
Most listings aren't bad — they're just weak in one spot, and nobody tells you which one. The Buust Score turns "optimize it somehow" into a single number and exactly one next step. Here's how to read it.

Seven Out of Ten Add to Cart — and Never Buy: Where Your Ready-to-Buy Visitors Disappear
They searched for your product, found it, added it to the cart — and vanished. These are not random visitors, these are your most ready-to-buy customers. Why they bail at the last moment — and how to kill the doubt before it kills the sale.